Data and Preliminary Analysis
Table 1. Data table showing station ID number, mean monthly sea ice concentrations, and relative abundance of key diatom species found in surface sediments. The diatom species names corresponding to A,B,C... are given in Table 2.

Species Data Exploration
A scatter plot comparison of the species was performed to observe the relationship between the key species (most abundant) identified in the surface sediments (Figure 8). From these graphs, one can see which diatom species are closely related to one another. Diatom species that are highly correlated are most likely associated with similar environmental conditions, while those that are inversely correlated are likely to be associated with different environmental conditions. It can be hypothesized that the diatoms that are highly correlated will form an assemblage based on further comparison with environmental data. However, there is no strong correlation between any of the diatom species.

Figure 8. Multiple scatter plots showing the correlation (or lack thereof) between all key diatom species. No diatom species are shown to be strongly correlated with another.
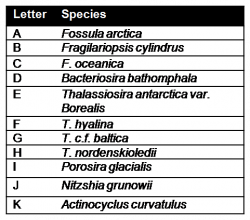
Table 2. Key species names corresponding to the respective letter assigned in analysis.
Simple pie charts were constructed based on previous research of the environmental conditions associated with the diatom species found in this study. Each diatom species was put in a category as either an indicator of "sea ice", "planktonic/open ocean conditions", "brackish water", "temperate" and "unknown". The results of this visual exploration were as expected. The higher latitude stations, where sea ice concentrations are generally higher for longer period of time each year, show a higher proportion of "sea ice" diatoms.

Figure 9. Map of study area showing relative abundances of diatom species found in surface sediments. Diatoms are grouped as either indicative of sea ice, open ocean, temperate, brackish or unknown based on the findings of previous studies.
Environmental Data Exploration
Average monthly sea ice concentrations between 1978 and 2008 for the stations in this study were calculated. Six months were selected to include in analysis based on knowledge of annual sea ice growth (starting in Oct), retreat (April-May), maximum extent (Feb-March), and minimum extent (August, September). Mean annual sea ice concentration between 1978 and 2008 is also included. A comparison between the mean sea ice concentration of these months was performed using multiple scatter plots (Figure 10). Of these months, April, May and February are strongly correlated with one another, as well as with annual sea ice. Due to this correlation, the months used for analysis were cut down to May, August, September, October and February.

Figure 10. Scatter plots comparing the mean sea ice concentrations for selected months (data ranging from 1978-2008) as well as the mean annual sea ice extent. Months were selected based on timing of sea ice growth/retreat.
